Solution


Pipeline Visual Inspection Robot

Oil and gas operations face increasing pressure to maintain aging pipeline infrastructure efficiently, safely, and cost-effectively. As global demand for energy rises, operators require more reliable, autonomous, and precise solutions for monitoring the integrity of pipelines—especially in remote or hard-to-reach environments. Pipeline robots have been designed for visual pipeline inspections.

Summary

  • Customer Need / Challenge

    Oil and gas operations face increasing pressure to maintain aging pipeline infrastructure efficiently, safely, and cost-effectively. As global demand for energy rises, operators require more reliable, autonomous, and precise solutions for monitoring the integrity of pipelines—especially in remote or hard-to-reach environments. Pipeline robots have been designed for visual pipeline inspections.

  • Interface Solution

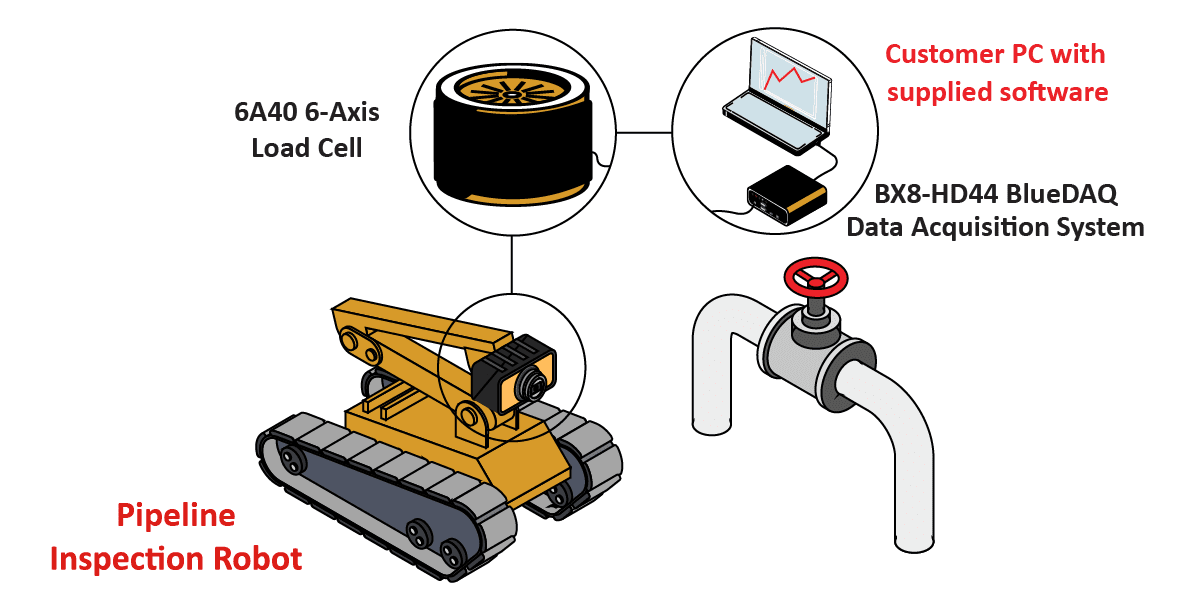
    Interface’s 6A40 6-Axis Load Cell can be integrated into robotic components like the arm, enabling enhanced control, sensitivity, and feedback during visual inspection and maintenance operations. These results can be logged, displayed, and measured when connected to Interface’s BX8-HD44 BlueDAQ Series Data Acquisition System with included BlueDAQ software.

  • Results

    Interface’s products demonstrated successful testing results for oil and gas pipeline inspection robots, confirming its capabilities in real-world environments.

Materials


  • 6A40 6-Axis Load Cell

  • BX8-HD44 BlueDAQ Series Data Acquisition System with included BlueDAQ software

  • Customer PC or Laptop

  • Customer’s inspection robot and control system

How it Works


  1. The 6A40 6-Axis Load Cell is installed at the head of the inspection robot, where the camera to visually inspect pipeline health moves.

  2. For data collection of force and torque measurements, the 6A40 6-Axis Load Cell interfaces with the BX8-HD44 BlueDAQ Series Data Acquisition System.

  3. The customer connected the BX8’s analog outputs to their control system. As a result, customer is able to log, display, and graph these measurements. The results are sent to the customer’s control system via analog or digital output.

Download PDF